9.9 Breaksite Plots
Breaksite plots show the distribution and frequency of breaks at per-base resolution for each non-singleton nominated break site. Visualisations are organised into subfolders per condition.
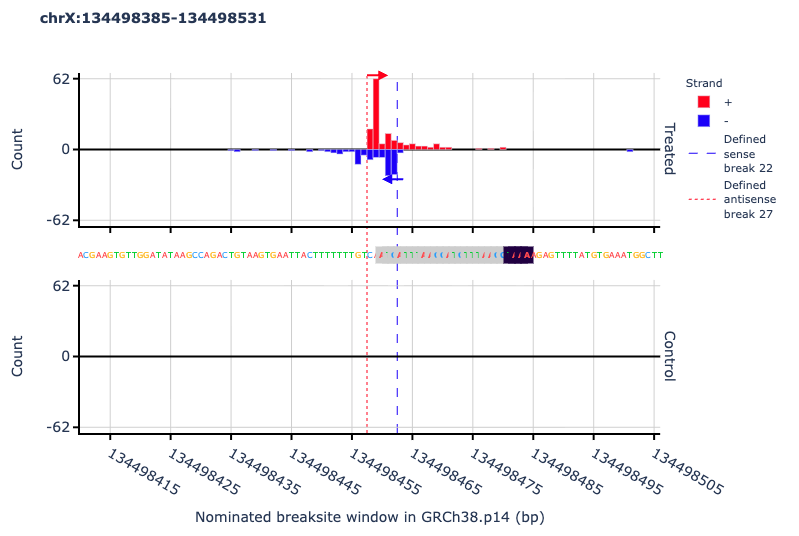
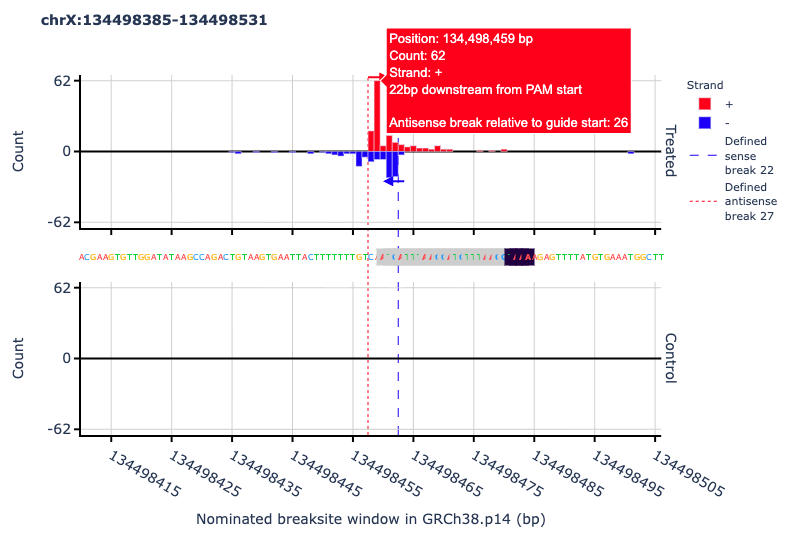
How to read a breaksite plot
- Red bars — breaks on the positive (+) strand.
- Blue bars — breaks on the negative (–) strand.
- For edited samples, the breaks observed in the appropriate control at the equivalent location are shown in a lower panel.
- The edited and control panels share the same y-axis scale to enable direct comparison.
- If a default or user-defined nuclease was specified, defined sense and antisense break positions are overlaid as dashed lines.
- Hover over a stack of breaks to view position, count, strand, and distance from PAM.