9.8 Homology-Based Outputs
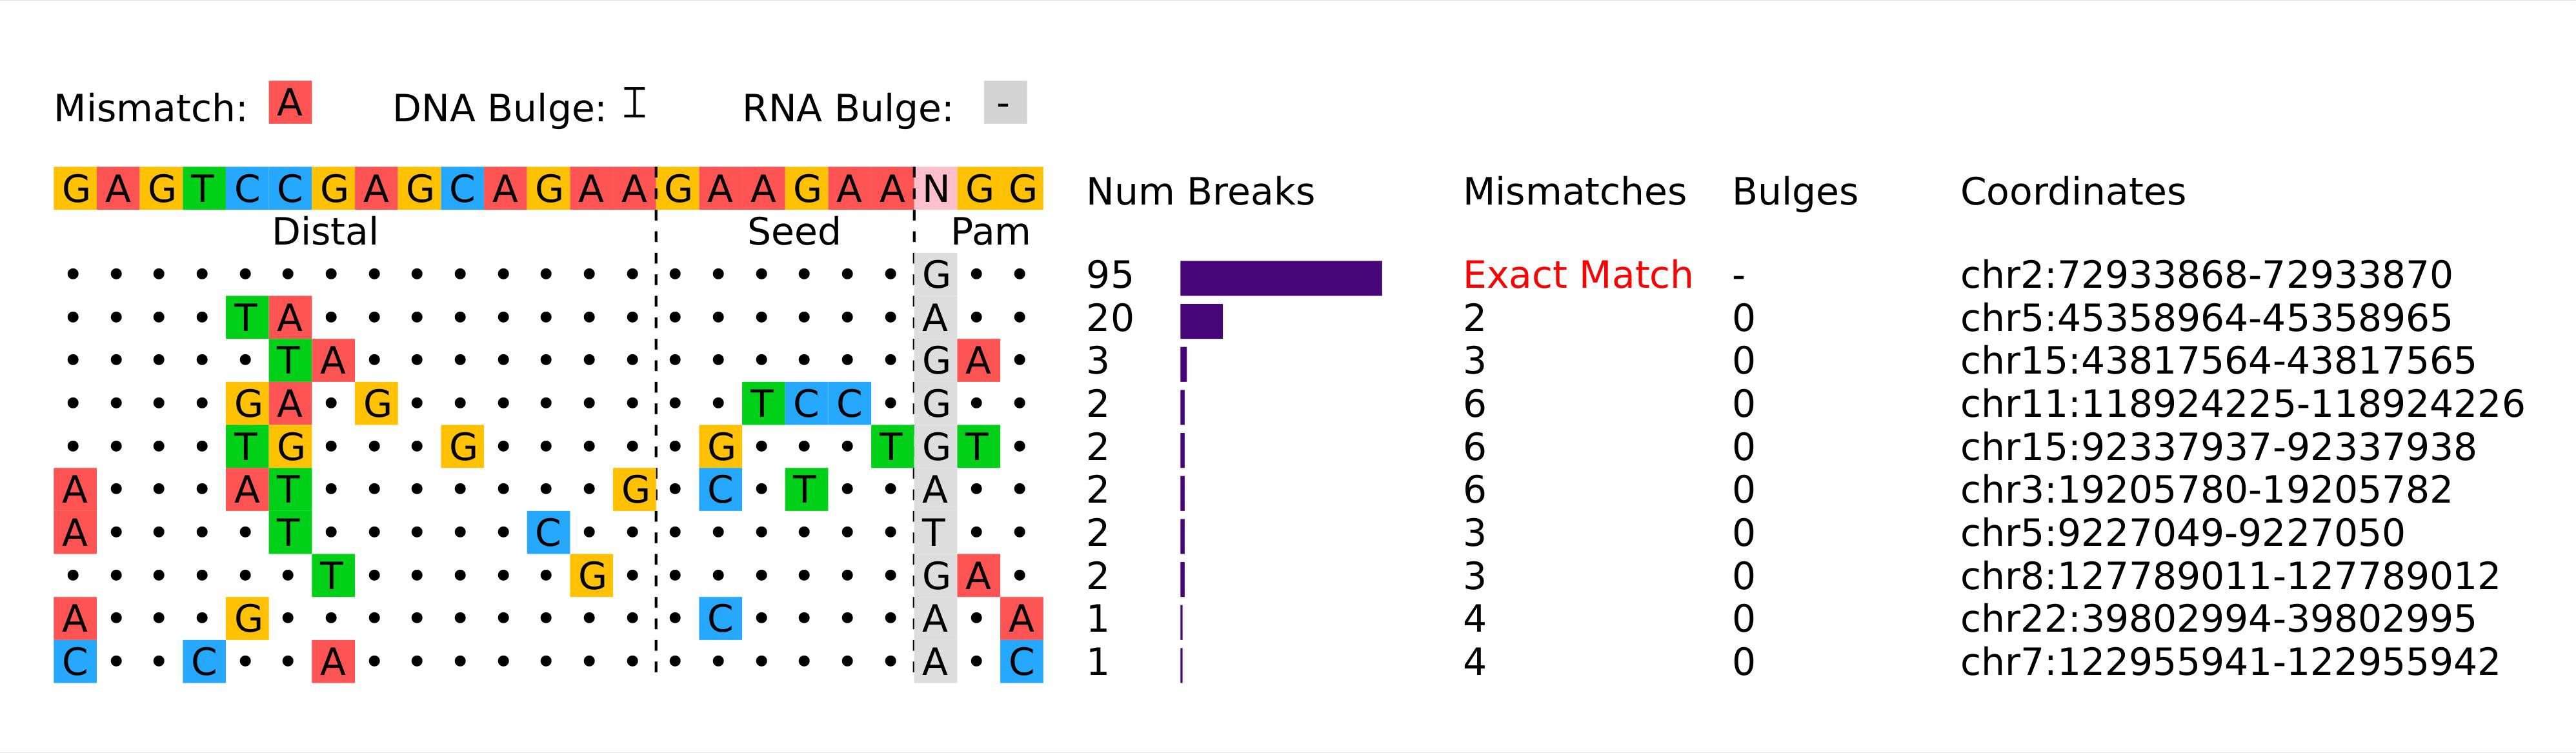
The *_mismatch_plot.jpg file provides a visualisation of observed break sites
intersected with in silico-predicted homology-based sequences.
Plot contents
- Break sites where observed breaks overlap with predicted cut sites based on guide sequence homology.
- The number, position, and base change for each mismatch to the guide sequence.
- The number of breaks at each break site.
Use the toolbar (upper-right corner) to zoom or download the plot.