9.3 QC Plots
QC reports are in the QC/ folder. Only plots for which QC metrics were provided will
be generated.
Interacting with plots
- Hover over data points to view exact values and percentages.
- Legend click to hide or show a metric.
- Download as PNG using the camera icon (upper-right corner).
- Pan / Zoom using the corresponding toolbar icons.
- Reset axis to return to the initial view.
Lab metrics plots
| File | Description | Target |
|---|---|---|
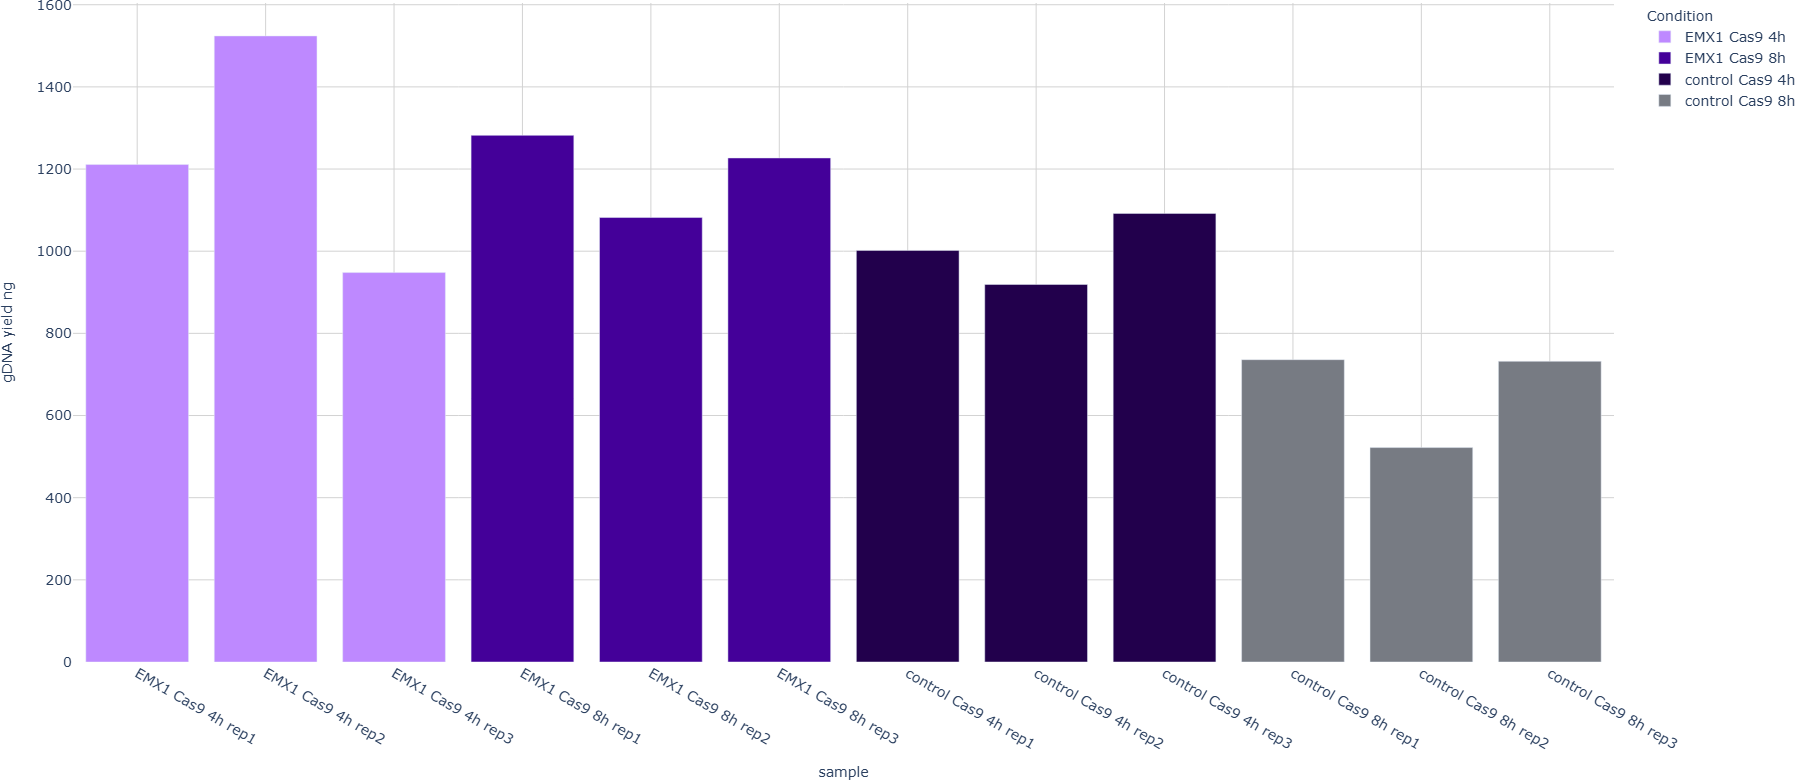
*_gDNA_yield_ng_barchart.html |
gDNA yield (ng) per sample. | ≥ 100 ng |
*_gDNA_yield_ng_grouped_barchart.html |
Average gDNA yield per condition with range. | ≥ 100 ng |
*_gDNA_yield_ng_v_library_yield_ng_scatter.html |
Correlation of gDNA yield vs library yield. | — |
*_gDNA_library_yield_ng_barchart.html |
Library yield (ng) per sample. | — |
*_library_yield_ng_grouped_barchart.html |
Average library yield (ng) per condition with range. | — |
*_qPCR_conc_pM_barchart.html |
Library concentration (pM) per sample. | ≥ 0.2 pM |
*_qPCR_conc_pM_grouped_barchart.html |
Average library concentration (pM) per condition with range. | ≥ 0.2 pM |
Break metrics plots
| File | Description |
|---|---|
*_absolute_breaks_barchart.html |
Absolute break counts per sample. |
*_normalised_absolute_breaks_per_ng_of_dna_yield_barchart.html |
Break counts normalised by ng gDNA per sample. |
*_absolute_breaks_grouped_barchart.html |
Absolute break counts grouped by condition. |
*_normalised_absolute_breaks_per_ng_of_dna_yield_grouped_barchart.html |
Normalised break counts grouped by condition. |
*_absolute_breaks_v_qPCR_conc_pM_scatter.html |
Correlation of absolute break numbers vs qPCR concentration (pM). |
*_read_loss.html |
Read counts at each filtering stage: total, mapped, properly paired, duplicated, MAPQ-filtered. Expected: > 75% primary reads. |
*_read_loss.xlsx |
Same data as above in tabular format. |
FastQC
Available for both raw and trimmed FASTQ files. Review trimmed output where possible.
| Metric | Description | Expected value |
|---|---|---|
| %Dups | Percentage of duplicate reads. | < 5% |
| %GC | Average GC content. | ~40% (human genomes) |
| Seqs | Total reads (millions). If the sum across replicates for one condition is < 0.1 million, a library preparation error may have occurred. This also appears as a warning in the analysis validation report. | — |
FastQC plots available
- Sequence Counts — bar chart of read counts per sample.
- Sequence Quality Histogram — mean quality score per base position. Expected post-trimming: Phred > 30 for all positions.
- Per Sequence Quality Scores — read count distribution by average quality score.
- Per Base Sequence Content — base percentages at each position. Note: failure of this metric is expected given the non-random nature of DSBs; the first few bases may not match the expected ~40% GC content.
- Per Sequence GC Content — distribution should form a smooth peak centred at ~40%.
- Per Base N Content — expected value near 0%.
- Sequence Length Distribution — slight length reduction post-trimming is expected. Trimming to < 75% of read length is unusual.
- Sequence Duplication Levels — relative duplication level per sequence.
- Overrepresented Sequences — count of overrepresented sequences per library.
- Adapter Content — cumulative percentage of adapter sequences by position.
- Status Checks — green (normal), orange (slightly abnormal), red (very unusual).